July 9, 2026

Digital Marketing

First-Party Data Marketing

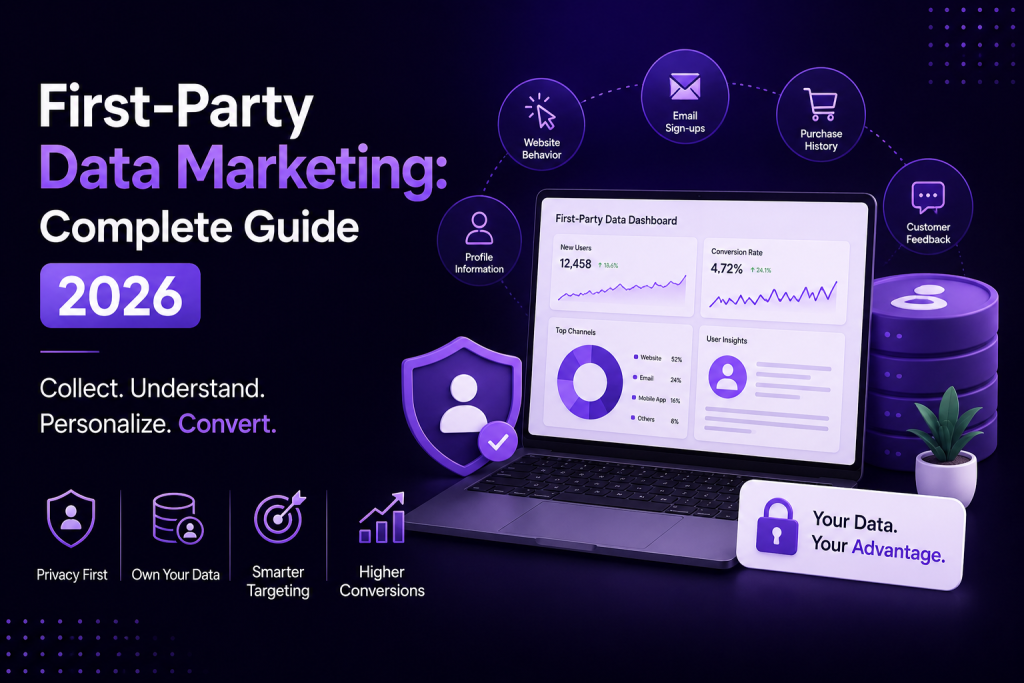
First-Party Data Marketing: The Complete Guide for Businesses in 2026 For years, marketers leaned on third-party cookies and purchased data lists to understand and target their audiences. That era is ending. Browsers have restricted tracking, regulations have tightened, and customers have grown far more cautious about who gets their data and why. In this new environment, first-party data marketing isn’t just a trend — it’s becoming the foundation of sustainable, trustworthy marketing. Businesses that build direct relationships with their customers and collect data responsibly are the ones set up to win in 2026 and beyond. This guide walks through everything you need to know: what first-party data marketing actually means, how it compares to other data types, proven collection strategies, tools, compliance considerations, and real examples of brands doing it well. What Is First-Party Data Marketing? First-party data marketing is the practice of collecting information directly from your own customers and audience — through your website, app, email list, purchase history, or customer interactions — and using that data to guide marketing decisions. Unlike data bought or borrowed from external sources, first-party data comes straight from people who have already engaged with your brand. That makes it more accurate, more relevant, and — critically — collected with the customer’s knowledge and consent. In simple terms: first-party data is information your business earns directly, not data you rent or borrow from someone else. Why First-Party Data Matters in 2026 Several forces have pushed first-party data to the center of modern marketing strategy. Third-party cookies are disappearing. Major browsers have phased out or restricted third-party cookie tracking, making it harder to follow users across the web. Privacy regulations are tightening. Laws like GDPR and CCPA (covered in detail later) require explicit consent for data collection, limiting how third-party data can be used. Customers expect privacy-respecting experiences. Many consumers say they’re more likely to trust brands that are transparent about data use. First-party data improves accuracy. Since it comes directly from real interactions, it tends to be more reliable than inferred or purchased data. It strengthens personalization. Owning accurate customer data allows for genuinely relevant messaging instead of generic targeting. It future-proofs marketing. As tracking restrictions grow, businesses with strong first-party data foundations are far less dependent on external platforms.   Put simply, first-party data marketing isn’t about following a trend — it’s about adapting to a marketing landscape where borrowed data is becoming less available and less reliable. Understanding the differences between data types helps clarify why first-party data is so valuable Data Type Source Accuracy Privacy Risk Example First-Party Data Collected directly by your business High Low (collected with consent) Website behavior, purchase history, email sign-ups Second-Party Data Another company’s first-party data, shared via partnership Medium-High Medium A travel brand sharing customer data with a partnered airline Third-Party Data Aggregated and sold by external data providers Variable, often lower Higher Data purchased from ad networks or data brokers   Key takeaway: First-party data offers the best combination of accuracy, relevance, and privacy compliance — which is exactly why it’s becoming the priority for forward-thinking businesses. Types of First-Party Data First-party data generally falls into a few categories: Behavioral data — pages visited, products viewed, time spent on site, clicks Transactional data — purchase history, order value, frequency of purchases Demographic data — age, location, gender, provided voluntarily Engagement data — email opens, click-through rates, app usage Zero-party data — information customers intentionally share, like preferences shared through a quiz or survey Customer service data — support tickets, chat interactions, feedback surveys   Zero-party data deserves special mention — it’s technically a subset of first-party data, but it’s explicitly and proactively shared by the customer, making it especially valuable and trustworthy. How Businesses Collect First-Party Data There are many practical, ethical ways to build a first-party data strategy: Website tracking (with consent) — using analytics tools to understand on-site behavior Email sign-ups — newsletters, gated content, or exclusive offers in exchange for an email address Account creation — encouraging customers to create profiles for order tracking or personalized recommendations Surveys and quizzes — collecting preferences directly, which doubles as zero-party data Loyalty programs — rewarding customers for sharing data and repeat engagement Purchase history — tracking what customers buy, how often, and at what value Customer support interactions — capturing feedback and common pain points Social media engagement — first-party interactions like comments, DMs, and shares (within platform data policies)   Expert insight: The most successful first-party data strategies don’t just collect data — they give customers a clear reason to share it, whether that’s better recommendations, exclusive perks, or a smoother experience. Best First-Party Data Marketing Strategies 1. Build Value-Driven Sign-Up Incentives Offer something genuinely useful in exchange for contact information — a discount, downloadable guide, or early access to new products. People share data more willingly when the exchange feels fair. 2. Use Progressive Profiling Instead of asking for everything upfront, collect information gradually over multiple interactions. A short sign-up form followed by an optional preference survey later feels far less intrusive. 3. Personalize Based on Behavior Use browsing and purchase data to tailor product recommendations, email content, and on-site messaging. Personalized experiences consistently perform better than generic ones. 4. Invest in a Customer Data Platform (CDP) A CDP consolidates data from multiple sources — website, email, app, purchases — into a single customer view, making segmentation and personalization far more effective. 5. Leverage Loyalty Programs Loyalty programs incentivize repeat engagement while naturally generating rich first-party data on preferences and purchase patterns. 6. Prioritize Transparent Consent Clearly explain what data you collect and why. Transparency builds trust, which in turn increases the likelihood customers will share data willingly. 7. Use First-Party Data for Retargeting Instead of relying on third-party cookies for retargeting, use your own website and email engagement data to build retargeting audiences directly on ad platforms. 8. Segment Audiences by Value and Behavior Not all customers are equal. Use first-party data to segment high-value customers, at-risk churners,
Digital Marketing

Conversion Rate Optimization (CRO) Best Practices in 2026

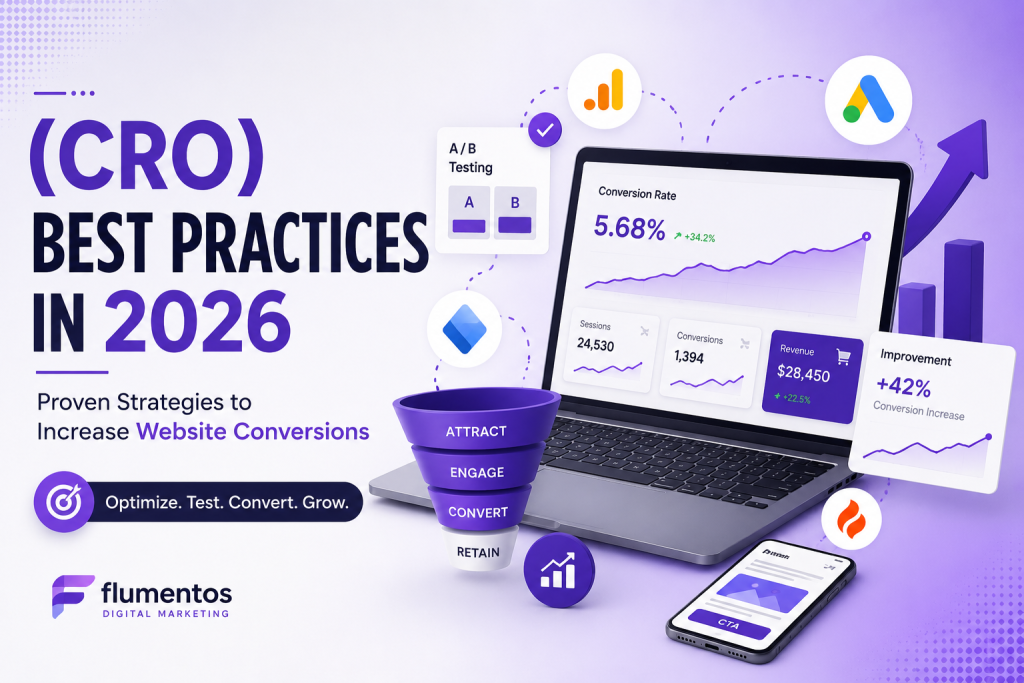
Conversion Rate Optimization (CRO) Best Practices in 2026: 15 Proven Strategies to Increase Website Conversions Getting traffic to your website has never been easier — and never been more expensive. Between rising ad costs, tighter budgets, and more competition than ever, businesses in 2026 can’t afford to keep sending visitors to a website that quietly lets most of them walk away. That’s exactly why Conversion Rate Optimization (CRO) has moved from a “nice to have” to a core growth strategy. If you’re already paying for traffic, the fastest way to grow revenue isn’t always more traffic — it’s converting more of the traffic you already have. This guide breaks down what CRO actually means, why it matters more than ever this year, and 15 proven strategies you can start applying today — whether you run an e-commerce store, a SaaS product, or a local service business. Why CRO Matters for Businesses in 2026 A few shifts have made CRO more important than it’s ever been: Rising ad costs. Every click costs more than it did a few years ago, so wasted visits hurt more. Shrinking attention spans. Visitors decide within seconds whether to stay or leave. AI-powered competition. Competitors are using AI to personalize experiences, raising the baseline expectation for every visitor. Privacy changes. With less third-party tracking data available, businesses need to convert more of the traffic they already have rather than relying on constantly finding new audiences. Multi-device browsing. Visitors move between mobile, desktop, and tablet, and friction on any device costs conversions.   The businesses winning in 2026 aren’t necessarily the ones spending the most on ads — they’re the ones converting the highest percentage of the traffic they already earn. How to Calculate Conversion Rate Conversion rate is one of the simplest — and most important — metrics in digital marketing. Formula:   Conversion Rate = (Total Conversions ÷ Total Visitors) × 100 Example: If your website had 20,000 visitors last month and 500 of them made a purchase, your conversion rate is: (500 ÷ 20,000) × 100 = 2.5% This means for every 100 visitors, 2.5 completed a purchase. Even a small increase — say from 2.5% to 3.5% — can mean a significant revenue boost without spending an extra rupee on traffic. Common Reasons Websites Fail to Convert Visitors Before diving into strategies, it helps to understand what typically causes visitors to leave without converting: Slow-loading pages that test visitors’ patience Confusing or cluttered navigation Unclear or missing calls-to-action Lack of trust signals like reviews or guarantees Long, complicated forms Poor mobile experience Generic messaging that doesn’t match visitor intent No urgency or reason to act now Hidden costs revealed late in checkout Weak or unclear value proposition Most of these issues are fixable — and that’s exactly what the strategies below address. 15 Proven CRO Best Practices in 2026 1. Understand User Intent Explanation: Before optimizing anything, you need to know why visitors are actually on your page. Someone searching “best running shoes” wants comparisons; someone searching “buy Nike Pegasus 41” is ready to purchase. Matching your page to that intent is the foundation of every other CRO tactic. Practical example: An online electronics store noticed high traffic but low conversions on a blog post about “best laptops for students.” The intent was informational, not transactional — so instead of a hard sell, they added a comparison table with a soft CTA linking to relevant product pages, which increased click-through to product pages by 34%. Implementation tips: Map keywords to intent (informational, navigational, transactional). Match page content and CTAs to that intent. Use search query reports to spot mismatches. Common mistakes: Using the same aggressive “Buy Now” CTA on informational content, or writing generic content that doesn’t address what the visitor actually searched for. 2. Improve Page Load Speed Explanation: Every extra second of load time increases the chance a visitor leaves before the page even finishes loading. Speed isn’t just a technical metric — it directly affects revenue. Practical example: A mid-sized fashion retailer reduced their homepage load time from 5.2 seconds to 2.1 seconds by compressing images and enabling browser caching. Bounce rate dropped noticeably, and conversion rate improved within the same month. Implementation tips: Compress and lazy-load images. Use a content delivery network (CDN). Minimize unnecessary scripts and plugins. Monitor Core Web Vitals regularly. Common mistakes: Adding heavy animations or auto-playing videos without considering their impact on load time; ignoring mobile page speed specifically. 3. Mobile-First Optimization Explanation: With most web traffic now coming from mobile devices, a desktop-first design approach quietly costs conversions. Mobile-first means designing the mobile experience as the primary version, not an afterthought. Practical example: A local restaurant chain redesigned their mobile ordering flow to reduce steps from five to three screens, resulting in a meaningful jump in completed mobile orders. Implementation tips: Use large, thumb-friendly buttons. Simplify menus and navigation for smaller screens. Test checkout and forms specifically on mobile devices. Common mistakes: Assuming a “responsive” design automatically means a good mobile experience; not testing on real devices. 4. Clear Call-to-Action (CTA) Explanation: A confusing or weak CTA is one of the most common conversion killers. Visitors shouldn’t have to think about what to do next — it should be obvious. Practical example: A SaaS company changed their homepage CTA from a vague “Learn More” to a specific “Start Your Free 14-Day Trial,” which led to a clear increase in sign-ups because it removed ambiguity about what clicking would do. Implementation tips: Use action-driven language (“Get,” “Start,” “Claim,” “Book”). Make CTAs visually distinct with contrasting colors. Limit the number of competing CTAs on one page. Common mistakes: Using generic text like “Submit” or “Click Here,” or placing multiple competing CTAs that confuse visitors about the primary action. 5. High-Converting Landing Pages Explanation: A landing page built specifically for a campaign — rather than sending traffic to a generic homepage — dramatically improves relevance and conversion rate. Practical example: A digital course creator built a

Digital Marketing

How to Measure Digital Marketing ROI in 2026

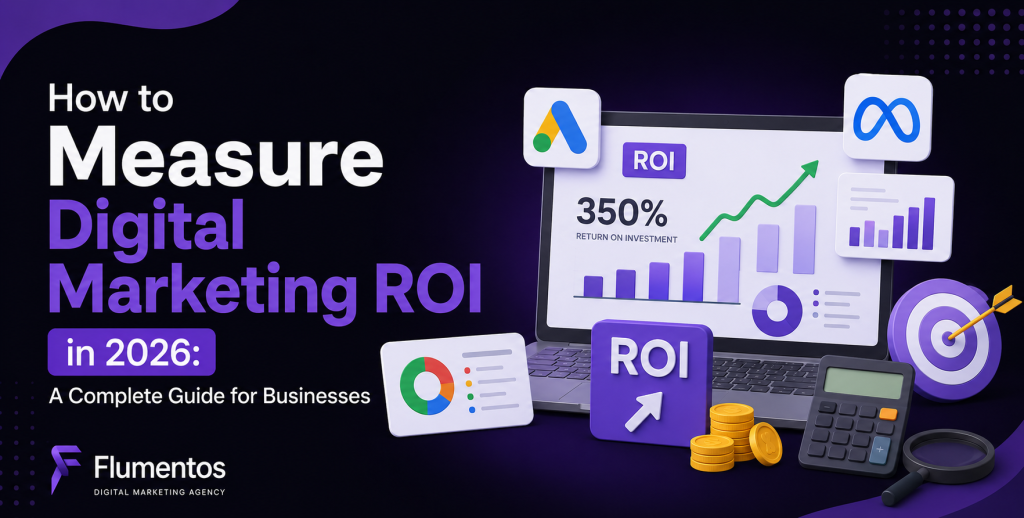
How to Measure Digital Marketing ROI in 2026: A Complete Guide for Businesses AD costs keep climbing, competition keeps growing, and “we got a lot of engagement” no longer satisfies anyone signing the checks. In 2026, businesses that survive tight budgets are the ones that can prove — in numbers — that marketing spend turns into revenue. This guide walks through exactly how to measure digital marketing ROI, step by step, without the jargon. What Is Digital Marketing ROI? Digital marketing ROI (return on investment) tells you how much profit your marketing generates relative to what you spent. Formula:   ROI = ((Revenue – Marketing Cost) ÷ Marketing Cost) × 100 Example: You spend ₹2,00,000 on a campaign and generate ₹6,00,000 in revenue. ROI = ((6,00,000 – 2,00,000) ÷ 2,00,000) × 100 = 200% That means for every rupee spent, you earned two back in profit — a strong result by most standards. Why Measuring Marketing ROI Matters in 2026 Better budget allocation — you can shift spend toward what actually works. Higher profitability — every campaign gets judged on real business impact. Smarter optimization — you fix underperforming channels before they drain budget. Data-driven decisions — less guesswork, more evidence. AI-powered reporting — automated tools now surface ROI trends in real time. Improved acquisition — you learn which channels bring profitable customers, not just traffic. Long-term growth — consistent ROI tracking compounds into sustainable scaling. Step-by-Step Guide to Measuring Digital Marketing ROI 1. Set clear marketing goals. Define what success looks like — sales, leads, sign-ups — before spending a rupee. 2. Define KPIs. Choose metrics tied to that goal (e.g., conversion rate for sales campaigns, CPL for lead gen). 3. Track conversions. Set up conversion tracking in Google Analytics 4 and ad platforms so every action is captured. 4. Measure revenue. Connect sales data (e-commerce platform or CRM) to your marketing reports. 5. Calculate marketing costs. Include ad spend, tools, freelancers, and team time — not just media cost. 6. Calculate ROI. Apply the formula above per campaign, channel, and overall. 7. Compare channels. See which channels deliver the best ROI, not just the most volume. 8. Optimize campaigns. Reallocate budget toward high-ROI channels and fix or pause weak ones. 9. Monitor regularly. Review weekly or monthly — ROI isn’t a one-time calculation.   Example: An online store tracks ₹50,000 spent on Meta Ads generating ₹1,80,000 in sales that month — a 260% ROI — versus Google Ads at ₹50,000 spent for ₹90,000 in sales (80% ROI). Budget shifts toward Meta. Essential Performance Marketing Metrics to Track Metric Formula Why It Matters ROI (Revenue – Cost) ÷ Cost × 100 Overall profitability ROAS Revenue ÷ Ad Spend Ad-spend efficiency CAC Total Acquisition Cost ÷ New Customers Cost to win a customer CLV AOV × Purchase Frequency × Lifespan Long-term customer value Conversion Rate Conversions ÷ Visitors × 100 Funnel effectiveness CPC Ad Spend ÷ Clicks Traffic cost CPA Ad Spend ÷ Conversions Cost per result CTR Clicks ÷ Impressions × 100 Ad relevance CPL Spend ÷ Leads Lead-gen efficiency Revenue Per Visitor Revenue ÷ Visitors Traffic monetization Average Order Value Revenue ÷ Orders Spend per transaction Bounce Rate Single-Page Sessions ÷ Total Sessions × 100 Landing page fit Retention Rate (End Customers – New) ÷ Start Customers × 100 Repeat business health MQLs / SQLs SQLs ÷ MQLs × 100 Sales-marketing alignment Track CAC and CLV together — a low CAC means little if customers never come back. Best Tools to Measure Digital Marketing ROI in 2026 Tool Primary Purpose Best For Free/Paid Key Features Google Analytics 4 Traffic & conversion tracking All businesses Free Funnels, attribution, events Google Tag Manager Tag/pixel management Technical tracking setup Free No-code tag deployment Looker Studio Dashboards Cross-channel reporting Free Custom visual reports Google Ads Search/display campaigns PPC advertisers Paid Conversion tracking, bidding Meta Ads Manager Social campaigns Facebook/Instagram ads Paid Audience insights, ROAS reports HubSpot CRM & marketing automation Lead-based businesses Freemium Pipeline & attribution tracking Semrush SEO & competitive analysis Organic growth Paid Keyword & traffic tracking Ahrefs SEO & backlink analysis Content/SEO teams Paid Rank tracking, site audits Hotjar Behavior analytics UX optimization Freemium Heatmaps, recordings Microsoft Clarity Behavior analytics Budget-conscious teams Free Heatmaps, session replays Common ROI Measurement Mistakes Tracking vanity metrics like likes and impressions instead of revenue. Ignoring attribution, over-crediting last-click channels. Not calculating total marketing costs — forgetting tools and team time. Focusing only on clicks, ignoring what happens after. Forgetting customer lifetime value when judging acquisition cost. Poor conversion tracking from broken or duplicate pixels. Not using dashboards, relying on scattered spreadsheets. Measuring results too early, before campaigns have enough data to judge fairly. How AI Is Improving ROI Measurement in 2026 AI now powers predictive analytics that flag underperforming campaigns before they waste budget, along with AI attribution models that fairly credit every touchpoint in the customer journey. Automated reporting pulls data across platforms into one view, while smart bidding adjusts spend in real time based on conversion likelihood. Tools increasingly offer customer journey analysis, AI dashboards, and predictive ROI forecasting, letting marketers see likely outcomes before committing full budgets — all tied together through broader marketing automation workflows. Practical Example A skincare brand spends ₹4,00,000/month across Google and Meta Ads, generating ₹11,00,000 in revenue. ROI: ((11,00,000 – 4,00,000) ÷ 4,00,000) × 100 = 175% ROAS: 11,00,000 ÷ 4,00,000 = 2.75x CAC: ₹4,00,000 ÷ 800 customers = ₹500 CLV: ₹1,200 AOV × 2.5 orders/year × 2 years = ₹6,000   Key insight: With CLV at 12x CAC, the brand has room to increase acquisition spend profitably — a decision ROI alone wouldn’t reveal without CLV context. Best Practices to Improve Marketing ROI Improve landing pages, increase conversion rate through UX fixes, sharpen audience targeting, run continuous A/B tests, adopt marketing automation, use AI for bid and budget optimization, apply multi-touch attribution, launch retargeting campaigns, invest in content marketing and SEO for compounding organic ROI, strengthen email marketing for low-cost repeat revenue, and

Digital Marketing

Performance Marketing: Metrics That Actually Matter

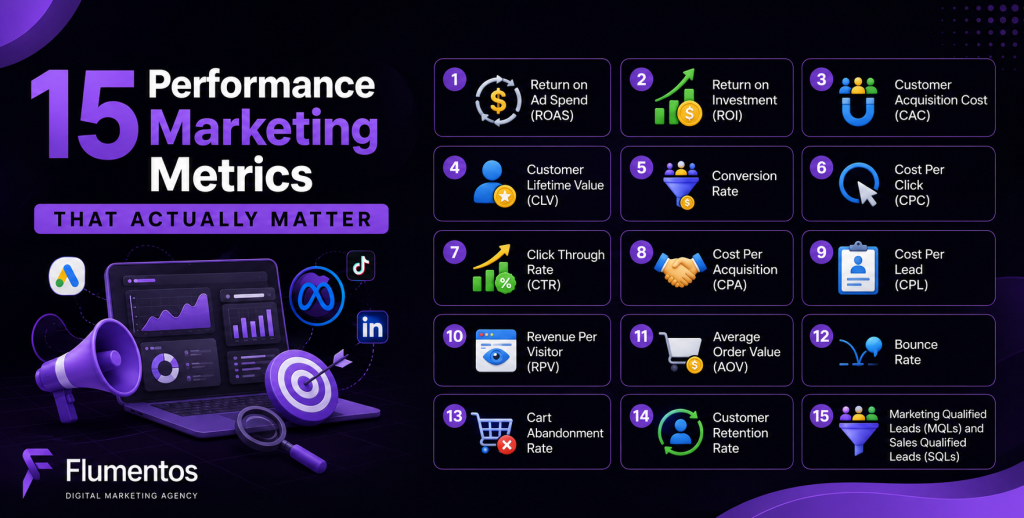
Introduction Most marketing dashboards are full of numbers — and most of those numbers don’t mean much. Impressions climb, likes pile up, reach charts look impressive in a slide deck, yet revenue barely moves. If you’ve ever presented a “great month” to your boss or client only to be asked, “Okay, but did we actually make money?” — you already know the problem. Performance marketing was built to fix exactly this. It’s supposed to be about measurable, accountable results — not vanity. But somewhere along the way, a lot of marketers started chasing the wrong numbers again, just dressed up in performance-marketing language. This guide breaks down the performance marketing metrics that genuinely move the needle in 2026 — what they mean, how to calculate them, what “good” looks like, and how to actually improve them. Whether you’re running your first Google Ads campaign or managing a seven-figure ad budget across channels, this is the metrics playbook you’ll want bookmarked. Table of Contents What Is Performance Marketing? Why Metrics Matter More Than Ever Vanity Metrics vs Actionable Metrics 15 Performance Marketing Metrics That Actually Matter Which Metrics Matter at Each Funnel Stage? Metrics for Different Marketing Channels Best Tools to Measure Performance Marketing Metrics Common Performance Marketing Mistakes How AI Is Changing Performance Marketing Measurement in 2026 Best Practices Real-World Example Frequently Asked Questions Key Takeaways Conclusion What Is Performance Marketing? Performance marketing is a form of digital marketing where advertisers pay only when a specific, measurable action happens — a click, a lead, a sale, an install. Unlike traditional advertising, where you pay for exposure regardless of outcome, performance marketing ties spend directly to results. Think of it this way: a billboard charges you for being seen, whether or not anyone acts on it. A performance marketing campaign charges you (in effort or budget) based on what people actually do — click through, sign up, or buy. Why Tracking Measurable Results Is Essential If you can’t measure it, you can’t improve it. Performance marketing lives and dies by data because: Budgets need justification — every rupee or dollar spent should trace back to a business outcome. Campaigns need optimization — you can only fix what you can see. Stakeholders need proof — “brand awareness” doesn’t pay salaries; conversions and revenue do. Traditional Marketing vs Performance Marketing   Aspect Traditional Marketing Performance Marketing Payment model Pay for placement (TV, print, billboards) Pay for results (clicks, leads, sales) Measurability Difficult to measure directly Highly measurable and trackable Feedback loop Slow, often quarterly Real-time or near real-time Optimization Limited, campaign ends before learnings apply Continuous, mid-flight optimization Risk Higher, upfront spend regardless of outcome Lower, spend tied to outcomes Examples TV ads, radio, print, hoardings Google Ads, Meta Ads, affiliate marketing, email Why Data-Driven Marketing Is Growing Rapidly in 2026 Marketing budgets are under more scrutiny than ever. Rising customer acquisition costs, tighter economic conditions, and increasingly sophisticated analytics tools mean businesses expect marketing to behave like a science, not an art project. Data-driven marketing lets teams justify spend, forecast outcomes, and make decisions based on evidence rather than instinct. Why Metrics Matter More Than Ever A few years ago, marketers could get away with reporting reach and impressions. That’s no longer good enough — and several shifts are responsible. AI-powered advertising. Platforms like Google and Meta now use machine learning to automate bidding and targeting. These systems need clean, accurate conversion data to work well. Feed them vanity metrics, and they’ll optimize toward the wrong outcomes. Privacy updates. Regulations and platform-level privacy changes have reduced the amount of user-level data available, making accurate measurement harder — and more valuable when done right. Cookie-less tracking. As third-party cookies phase out across browsers, marketers are shifting to first-party data and modeled conversions, which requires stronger internal measurement systems. Multi-channel marketing. Customers rarely convert from a single touchpoint. They see a social ad, search on Google, read a review, then buy. Understanding which metrics matter at which stage is critical to avoid misattributing credit. Rising ad costs. CPCs and CPMs have climbed steadily across most industries. Every wasted rupee stands out more than it used to. Better attribution models. Modern tools use multi-touch and AI-driven attribution instead of simple last-click models, giving a more accurate picture of what’s actually driving conversions. Put simply: marketers who still lean on impressions and likes as primary success metrics are flying blind in an environment where everyone else is using instruments. Vanity Metrics vs Actionable Metrics Not all metrics are created equal. Some make a report look good; others tell you whether the business is actually growing. Vanity Metrics Actionable Metrics Likes Conversion Rate Followers ROAS (Return on Ad Spend) Reach CAC (Customer Acquisition Cost) Impressions CPA (Cost Per Acquisition) Page views Revenue Video views CLV (Customer Lifetime Value) Social shares Retention Rate Vanity metrics aren’t useless — they can hint at brand visibility or content resonance. The problem is treating them as proof of business impact. A post can get thousands of likes and generate zero revenue. A campaign with modest reach but a strong conversion rate can outperform it many times over. The rule of thumb: if a metric can’t be tied, directly or indirectly, to revenue, retention, or cost efficiency, treat it as supporting context — not a success indicator. 15 Performance Marketing Metrics That Actually Matter 1. Return on Ad Spend (ROAS) Definition: ROAS measures the revenue generated for every unit of currency spent on advertising. Why it matters: It’s the most direct measure of whether your ad spend is profitable. It’s platform-agnostic and works across Google Ads, Meta Ads, and beyond. Formula:   ROAS = Revenue from Ads / Ad Spend Example: If you spend ₹1,00,000 on ads and generate ₹4,00,000 in revenue, your ROAS is 4:1, or 400%. Industry benchmark: A “good” ROAS varies widely by industry, margin, and business model — e-commerce brands often target 3:1 to 5:1, but benchmarks should always be evaluated against your own margins, not generic

Scroll to Top